
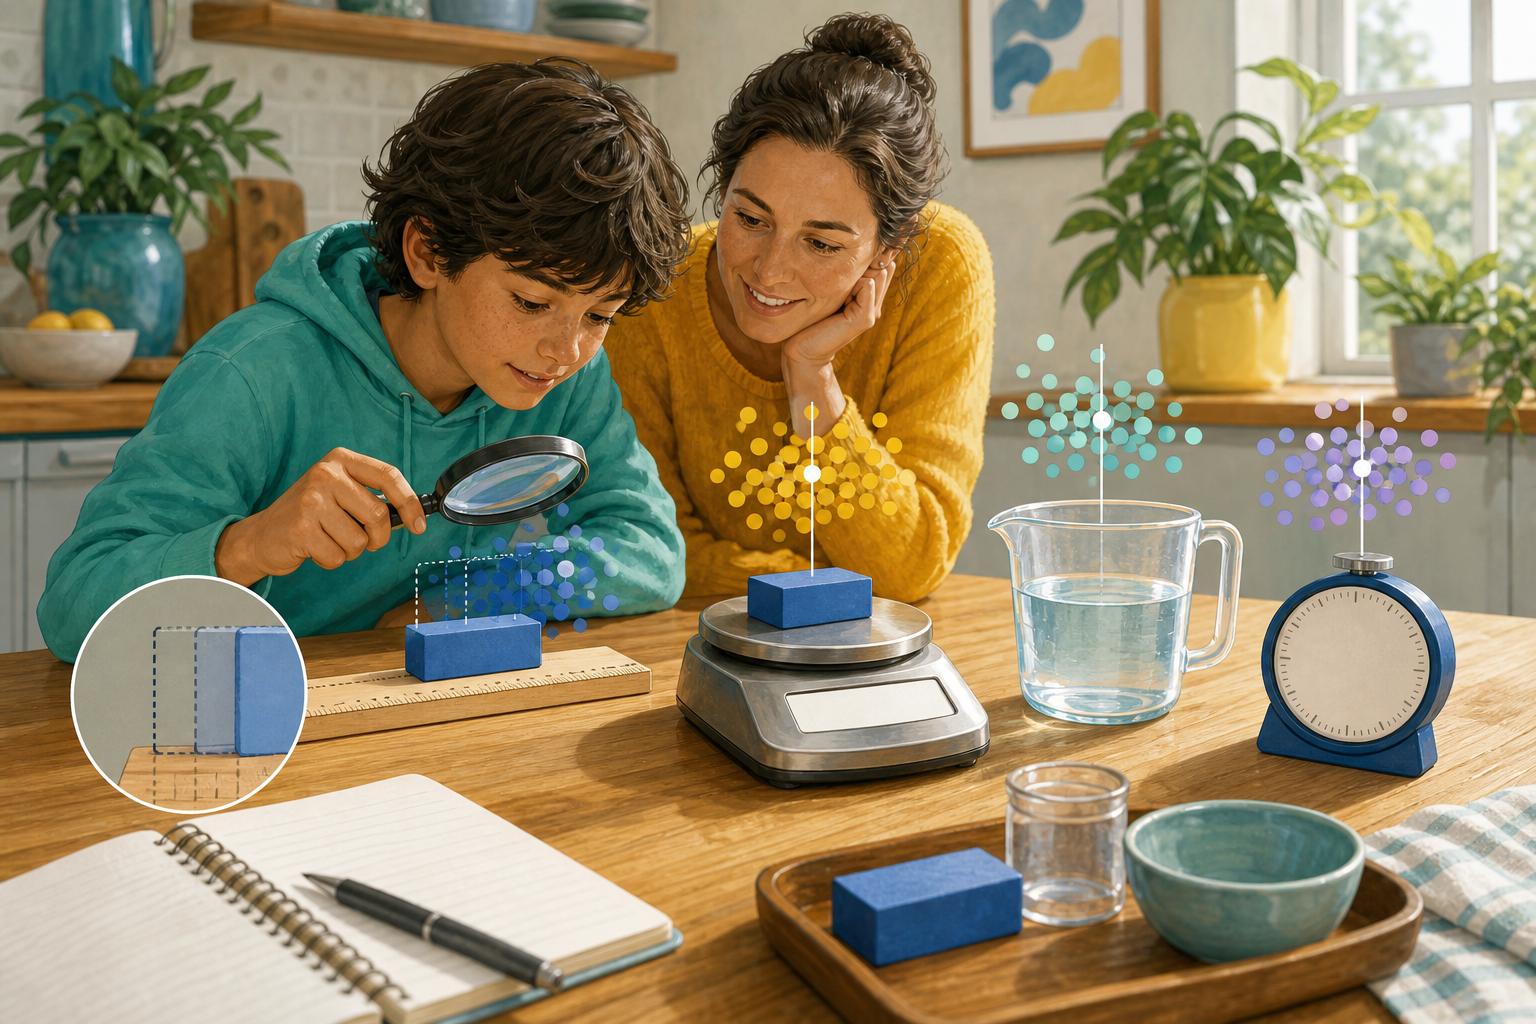
A pencil looks like a simple object to measure. Place it beside a ruler, read the number, and the job seems finished. Yet ask five people to measure the same pencil and their answers may differ slightly. One starts at the worn edge of the ruler instead of the zero mark. Another looks from an angle. A third rounds to the nearest centimetre while someone else records millimetres. The pencil has not changed, so why have the numbers?
This is where science becomes detective work. A measurement is not a perfect label hidden inside an object. It is a carefully made comparison between something we want to know and an agreed unit. Every comparison is shaped by the tool, the method, the observer, and the conditions. Small differences are therefore not automatically signs that an experiment failed. They are clues about how the measurement was made.
Learning to investigate those clues is one of the most useful scientific habits a beginner can develop. It replaces the urge to force every result into agreement with a better question: what could reasonably explain the variation?
What a measurement really contains
A recorded measurement has more information than its number. Imagine a note that says a leaf is 8.4 centimetres long. Hidden behind that statement are several decisions: which end points counted, whether the curved leaf was flattened, what ruler was used, how closely the scale could be read, and whether the reader rounded up or down.
A strong science notebook brings some of that hidden information into view. It records the value and unit, then gives enough method detail for another person to repeat the comparison. Instead of writing only 8.4, the investigator might write 8.4 centimetres, measured from the base of the stem to the tip with a millimetre ruler while the leaf rested flat.
The longer note is not fussy decoration. It distinguishes a scientific observation from an unexplained number. It also creates a trail that can be checked if later results look surprising.
Error does not mean mistake
In everyday speech, an error often means somebody did something wrong. In measurement, the word has a wider meaning. It includes the gap between a measured value and the unknowable perfectly exact value. Even careful work has limits because tools have finite markings, conditions change, and people must judge where an edge or pointer lies.
A mistake is different. Reading the wrong scale, forgetting a unit, moving the starting point, or copying 3.6 as 6.3 can often be prevented or corrected. Measurement uncertainty cannot be removed completely. It can only be understood, reduced where practical, and reported honestly.
This distinction changes the mood of an investigation. A student who believes every difference is a personal failure may hide an odd result. A measurement detective preserves it, checks it, and asks what it reveals about the procedure.
Three clues: accuracy, precision, and repeatability
These ideas are related, but they answer different questions.
- Accuracy asks whether a result is close to a trustworthy accepted value or to the best available estimate.
- Precision describes how finely a tool or result distinguishes values. A ruler marked in millimetres supports finer readings than one marked only in centimetres.
- Repeatability asks whether the same method, used again under similar conditions, produces similar results.
A group can produce tightly clustered measurements that are all shifted in the same direction. That work may be repeatable but inaccurate, perhaps because every measurement began at a damaged ruler edge. Another group can scatter around a sensible value because each person used a different end point. Looking only at an average could hide both stories. Looking at the pattern helps identify them.
Build a measurement detective kit
The most important tools are not expensive. A useful kit includes a clear procedure, an appropriate measuring instrument, a table prepared before testing, and a habit of repeating observations. A pencil, masking tape, scrap card, stopwatch, measuring cup, kitchen scale, and thermometer can support many investigations when used safely and with adult guidance where needed.
Before collecting a number, ask five questions:
- What exactly am I trying to measure?
- Which unit makes sense for this size and situation?
- Where does the measurement begin and end?
- How finely can this tool honestly be read?
- What must stay the same when I repeat the test?
Writing the answers first prevents the method from quietly changing halfway through. It also makes disagreement useful: two investigators can compare procedures instead of arguing over whose number looks right.
Case file one: the wandering length
Suppose a class measures the width of a desk. The results range from 59.7 to 60.4 centimetres. Begin by checking the starting point. Some rulers have space before zero, and some tape measures have hooks that slide slightly by design. Next, inspect alignment. A ruler tilted across the surface traces a longer diagonal path. Then check viewpoint. Reading a scale from the side can make the edge appear beside a different mark, an effect called parallax.
The team can improve the method by placing small pieces of removable tape at agreed end points, aligning the tool straight between them, and viewing the final mark from directly above. Three repeated readings by each person reveal whether the improved method reduces the spread.
The lesson is larger than desk width. Clear end points and consistent alignment matter whenever length is measured, from a seedling’s height to the distance a toy car travels.
Case file two: the slippery stopwatch
Timing introduces a different challenge. If someone starts a stopwatch when a ball is released and stops it when the ball reaches a line, their reaction occurs after the visible event. The delay may vary from trial to trial. A display that shows hundredths of a second can create the impression of extreme precision, but the human start and stop may not justify trusting every displayed digit.
A better design may time ten repeated cycles instead of one, then divide the total by ten. The reaction delay becomes a smaller fraction of the overall interval. Another improvement is assigning one person to operate the stopwatch for every trial while another releases the object consistently. Video can sometimes help with later frame-by-frame inspection, but it introduces its own limits, including frame rate and choosing the exact event frame.
The detective’s goal is not to find a magical tool with no limits. It is to choose a method whose limits are small enough for the question being asked.
Case file three: a changing temperature
Temperature readings can disagree because the thing being measured is changing while the measurement happens. A thermometer placed in warm water needs time to respond. Its position matters: water near the container wall may cool faster than water near the centre. Stirring changes how evenly heat is distributed. Holding the sensing end with warm fingers can also affect some measurements.
A consistent method might specify the same depth, the same central position, gentle stirring, and a fixed waiting period before reading. The container and amount of water should remain the same. If the experiment studies cooling, the clock should start at an agreed moment and readings should occur at regular intervals.
Here the variation is not only about the observer. It also reveals that temperature is a property of a system moving toward balance. An awkward measurement becomes a doorway into deeper science.
Random variation and one-direction shifts
Measurement clues often form two broad patterns. Random variation moves readings unpredictably above and below a central region. Slight reaction-time changes, tiny differences in where a bouncing ball lands, or a flickering final digit can create this pattern. Repeating measurements and examining their range helps describe it.
A systematic shift pushes results mainly in one direction. A scale that reads 5 grams before anything is placed on it may add roughly that amount to every result. A printed ruler copied at the wrong size may shrink every measured length. Repetition alone does not repair this problem; ten shifted readings can agree beautifully while remaining misleading.
To investigate a one-direction shift, check the tool against a known point, inspect the zero setting, compare with a second instrument, and review the procedure for assumptions shared by every trial.
Make a table that preserves the clues
A useful data table is designed before the experiment. Each column has a name and unit. Each trial gets its own row. Conditions that might explain a result, such as surface type or starting height, are recorded rather than trusted to memory. Notes sit beside values instead of replacing them.
For a toy-car investigation, columns might include trial number, ramp height in centimetres, travel distance in centimetres, and observation notes. A note such as car touched wall explains why one distance should not be treated as an ordinary trial. The value should usually remain visible, marked and discussed, rather than silently erased.
After several trials, find the lowest and highest values, identify the cluster, and calculate a typical value if that helps answer the question. An average is useful only when the underlying measurements belong together. If half the trials used carpet and half used tile, one combined average may conceal the most interesting difference.
Investigate an outlier without putting it on trial
An outlier is a value noticeably separated from the others. It may come from a copying mistake, an unusual event, a changed condition, or genuine natural variation. Its appearance alone does not tell which explanation is correct.
Use a calm inspection sequence:
- Check that the value and unit were copied correctly.
- Read the observation note for that trial.
- Inspect whether the method or conditions changed.
- Repeat the trial when repetition is safe and meaningful.
- Report what was done with the value and why.
Deleting a result merely because it spoils a neat pattern trains the wrong habit. Science values an honest record more than a perfect-looking graph.
A beginner investigation: which paper bridge holds more?
Create two equal stacks of books with a small gap between them. Lay one sheet of paper across the gap as a flat bridge. Add identical coins one at a time near the centre until the bridge collapses, keeping fingers clear as the coins fall. Repeat at least five times. Then fold a fresh sheet into an accordion shape and test again with the same gap, paper size, coin type, and placement method.
The measured value is the number of coins supported before collapse. Yet detectives will notice judgment questions. Does the final coin count if collapse begins while it is being placed? How central must each coin be? Does a crease weaken the paper between trials? A clear rule might count only coins fully released before collapse and use fresh paper for every trial.
Record every trial rather than only the best performance. Compare ranges as well as averages. If the folded bridge usually supports more but one trial fails early, inspect the fold pattern and coin placement. The unexpected result may teach more about structure than the expected ones.
Report only the digits the method deserves
A calculator can produce many decimal places, but extra digits do not create extra knowledge. If distances were read only to the nearest centimetre, reporting an average as 42.666666 centimetres suggests confidence the method never had. Rounding the summary to a level consistent with the measurements is more honest.
Words matter too. Instead of declaring that one design is always stronger, say that it supported more coins in this set of trials under these conditions. That statement is narrower, but it is also testable and trustworthy. Another group can change paper thickness, gap width, or fold shape and ask whether the pattern continues.
The detective’s final report
A strong conclusion answers the original question, uses the observed pattern, and names important limits. It can follow four moves: state what happened, give key values, explain the likely mechanism, and describe one improvement or next test.
For example: The accordion bridge supported more coins in four of five comparisons. Its folded shape resisted bending, although differences in fold width may explain the wider range. A guide for equal folds would make the next test more consistent. This conclusion neither hides variation nor lets it overwhelm the result.
Better measurement is better thinking
The deepest lesson is not how to hold a ruler or read a stopwatch, though those skills matter. It is how to respond when reality refuses to produce one perfectly tidy number. Measurement errors invite patience, comparison, and revision. They teach that confidence should grow from a transparent method, not from the number of digits on a screen.
A beginner who keeps odd results, labels units, repeats trials, and explains limitations is already practising serious science. The ordinary errors on a classroom table are not obstacles on the way to discovery. Properly investigated, they are part of the discovery itself.